Data Analyst TrainingStarts 4 Oct · Sundays 5-7pm · Live online
£500 · Instalments by arrangementEnrol now
● 10-WEEK LIVE ONLINE PROGRAMME

Don't just learn the tools. Learn to think like a Data Analyst.

A practical 10-week programme that teaches you how to turn business questions into trustworthy analysis using Excel, SQL and Power BI. Work with realistic data, build projects you can explain confidently, and learn live from an experienced BI leader.


Starts: Sunday 4 October 2026Live: Sundays 5-7pm UKLevel: Beginner-friendly
Adewale Omobayo, Data Analyst Training programme trainer
Your trainerAdewale OmobayoSenior Business Intelligence & Data Leader
MSc Computer Science with Data Analytics
View LinkedIn profile ↗
Senior BI leadership experienceReal-world analytics, intelligence and transformation leadership.
20+ hours live teachingInteractive sessions, explanations and guided practice.
One business, multiple toolsFollow the same case from raw data to recommendation.
Projects + career supportBuild evidence you can discuss at interview.
Adewale Omobayo at his desk, with a data dashboard on screen
Meet your trainer

Learn data analysis from a real-world practitioner.

Adewale Omobayo is a senior Business Intelligence and Data leader with experience helping organisations turn complex information into decisions.

His background spans BI leadership, health intelligence, data governance, reporting, digital transformation and modern data platforms. His hands-on toolkit includes Power BI, SQL, Python and cloud-based analytics technologies.

Alongside his analytics leadership work, Adewale supports professional education and development. This programme brings those two worlds together: practical analytical experience and structured teaching.

The goal is not to teach you where buttons are. It is to help you understand the question, challenge the data, choose the right analysis and explain what the result means.

Senior BI & Data LeadershipExperience leading analytics and intelligence functions.
MSc Computer Science with Data AnalyticsAcademic grounding combined with workplace delivery.
Hands-on Technical ExperiencePower BI, SQL, Python, data platforms and governance.
Professional Training ExperienceSupporting structured learning and professional development.
See Adewale's professional background on LinkedIn ↗
Why this programme is different

This is not a "watch videos and hope" course.

The programme is built around live explanation, realistic business problems and work you can actually show and discuss.

Learn live

Ask questions in the moment, answer live knowledge checks and work through difficult concepts with the trainer rather than learning alone.

Work with realistic data

Follow one fictional company, Harbourline Supplies, across Excel, SQL and Power BI instead of jumping between unrelated toy datasets.

Build evidence of what you can do

Complete Excel, SQL, Power BI and capstone work that demonstrates your thinking, not simply your ability to follow instructions.

The analytical journey

Follow one business from question to recommendation.

You will return to Harbourline Supplies throughout the programme, seeing how the same business question evolves across different analytical tools.

1
Business questionClarify the decision
2
Raw dataUnderstand the grain
3
Clean in ExcelProfile and validate
4
Analyse in SQLQuery the business
5
Model in Power BIBuild useful measures
6
Explain the storyWhat happened and why
7
Recommend actionWhat should happen next
See the programme, not just the promises

A real learning environment, already built and ready for Week 1.

Your course materials, case study, learner portal, projects and progress tracking are designed as one connected learning experience.

RoundUp Tech Learning
Learner view
Welcome back 👋
Your learning progress follows you across devices.
Next live classWeek 1 · Thinking Like a Data AnalystSunday 4 Oct · 5:00-7:00pm UK
Before classWorkbook · Business Brief · Handbook
Progress0 / 10 weeks · Ready to start
Knowledge checksUnlock after each live class
ProjectsExcel · SQL · Power BI · Capstone

Your private learner portal

One place for your schedule, learning materials, projects, knowledge checks, career resources and progress.

Secure learner loginWeekly resourcesProgress trackingCareer hub

Already enrolled? Sign in to the learner portal ↗
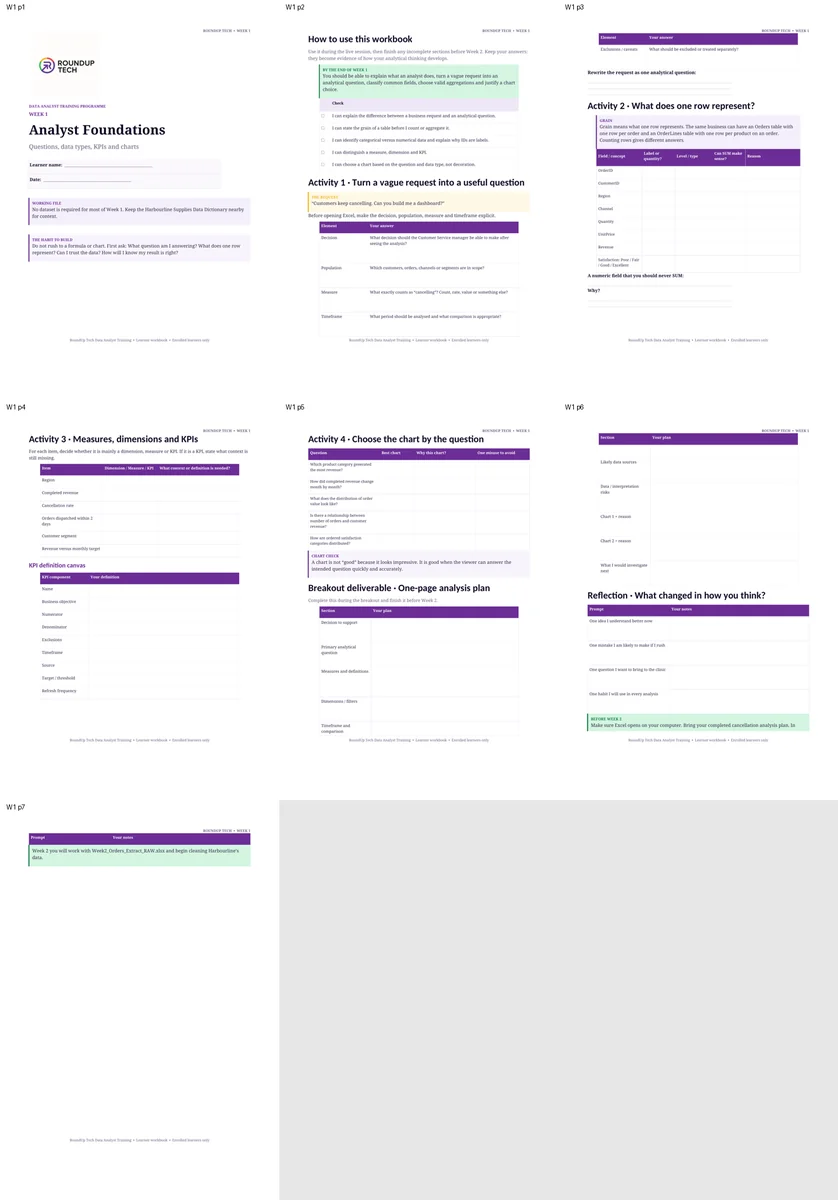
Preview of the RoundUp Tech Week 1 learner workbook

Guided workbooks, not passive notes

Each workbook turns the live lesson into an activity. Week 1 starts with analytical thinking before the first dataset is introduced in Week 2.

Business questionsKPIsGrainChart choice
Your 10-week journey

Every week answers: what will I be able to do?

The tools matter, but the bigger goal is learning how analysts reason, validate and communicate.

WEEK 1
04 OCT

Think Like a Data Analyst

Turn vague stakeholder requests into clear analytical questions. Understand data types, KPIs, grain and chart choice.

WEEK 2
11 OCT

Clean Data with Excel

Take a messy business extract and begin turning it into analysis-ready data using tables, formulas, IF and lookups.

WEEK 3
18 OCT

Analyse with Excel

Use PivotTables, charts and exploratory analysis to identify patterns and explain what the numbers mean.

WEEK 4
25 OCT

SQL Fundamentals

Retrieve, filter, sort, group and summarise business data with clear, reproducible queries.

WEEK 5
01 NOV

SQL for Real Analysis

Join tables and answer more complex questions using JOINs, CASE, CTEs and subqueries.

WEEK 6
08 NOV

Trust the Data

Identify missing data, duplicates, unusual values and misleading summaries. Learn when an average helps and when it hides the story.

WEEK 7
15 NOV

Power BI & Power Query

Transform, model and visualise the same Harbourline business data in Power BI.

WEEK 8
22 NOV

DAX & Dashboard Design

Create measures, KPIs and dashboards that help people answer clear questions rather than simply display data.

WEEK 9
29 NOV

Tell the Story

Turn analysis into findings, recommendations and stakeholder conversations. Use AI responsibly as an analytical assistant.

WEEK 10
06 DEC

Present Your Work

Complete your capstone, present your analysis and practise explaining your analytical decisions in interviews.

How learning works

A weekly rhythm designed to make the learning stick.

You will prepare, practise live, reinforce after class and keep building during the week.

Before class

Arrive with context

Open the short brief and learner workbook so the session can focus on thinking and practice.

During class

Learn, answer, discuss

See worked examples and answer live knowledge questions that the trainer can use to explain misconceptions.

After class

Check your understanding

Complete the weekly knowledge check, review explanations and continue the practical exercise.

During the week

Build evidence

Progress your project, practise independently and use support routes when you get stuck.

What you'll leave with

Not just notes. Work you can explain.

The programme is designed to leave you with tangible evidence of how you approach data problems.

  • A cleaned and documented Excel analysis
  • SQL queries answering business questions
  • An interactive Power BI report
  • A capstone business analysis and presentation
  • Portfolio-ready examples of your analytical thinking
  • CV, LinkedIn and interview guidance
  • Certificate of Completion, subject to programme requirements
01
Excel project

Clean and analyse a realistic extract, then explain what the numbers mean.

02
SQL exercises

Answer increasingly complex business questions with reproducible queries.

03
Power BI project

Transform, model and visualise Harbourline data in an interactive report.

04
Capstone

Answer three questions: What happened? Why does it matter? What should happen next?

What do employers actually expect from a new analyst?

Some of the most valuable lessons are rarely found in software tutorials. Selected experienced professionals may join the programme for candid conversations about real working life, mistakes, interviews, stakeholder expectations and career progression.

Guest participation is subject to professional availability and complements the core instructor-led programme.

Industry Leader Conversations

Hear what the job is really like.

Employer expectationsWhat makes a developing analyst useful from day one?
Common mistakesWhat experienced analysts wish they had understood earlier.
Stakeholder workHow real requests differ from tidy classroom exercises.
Career routesPaths into analytics, BI, reporting and insight roles.
InterviewsHow to explain projects without overstating experience.
AI in analyticsHow to use AI responsibly without outsourcing judgement.
Enrolment

Secure your place.

Your place is secured when your payment is successfully received. Stripe securely handles your card details.

Prefer to pay in instalments?

Instalment arrangements are available by agreement. Email the training team before you enrol and we will agree a payment schedule with you. The number of payments, dates and total will be confirmed in writing before you commit.

  • Tell us which schedule would work for you
  • We confirm the arrangement in writing
  • Your place is secured once the first payment is received
Contact the training team

Or email training@rounduptech.com

Have a valid RoundUp Tech promotion code? Enter it on the secure Stripe checkout page. Private eligibility codes are not published here.
Before you enrol

Frequently asked questions

The programme is taught by Adewale Omobayo, a senior Business Intelligence and Data leader with experience across analytics, health intelligence, governance, digital transformation and professional development. You can view his LinkedIn profile from the trainer section above.
No. The programme is designed to be beginner-friendly, while still expecting you to practise and complete project work between sessions.
The core programme includes a minimum of 20 hours of live instructor-led training across 10 weeks. Guest industry conversations may provide additional live learning time where scheduled.
You will need Microsoft Excel through Microsoft 365 (some functions we use are not in Excel 2021 or earlier), Power BI Desktop and a reliable internet connection. Power BI Desktop runs on Windows only, so if you use a Mac you will need access to a Windows computer or a Windows cloud PC for the Power BI weeks. Power BI Desktop and SQL Server Express are free, and setup guidance is provided before each module. If you are unsure whether your computer will work, email the training team before you enrol and we will check with you.
Every live session is recorded and shared with enrolled learners, so you can catch up on anything you miss. Live attendance still counts towards the Certificate of Completion, which normally requires attending at least 80% of live sessions. See the training terms for full details.
Allow two hours for the live Sunday class plus approximately two to four hours for practice, exercises and project work where possible.
No. The programme develops skills, practical evidence, portfolio material and career readiness, but employment, promotion, interview success or salary outcomes cannot be guaranteed.
The fee for the October 2026 cohort is £500, paid in full at enrolment. There are no further compulsory costs. If you would prefer to pay in instalments, email training@rounduptech.com before enrolling and we will discuss an arrangement with you.
Online enrolments are subject to applicable UK consumer cancellation rights and the arrangements set out in the RoundUp Tech Training Terms & Conditions and Refund Policy.
Ready to begin?

Learn the tools. Build the judgement. Show the work.

Starts Sunday 4 October 2026. Questions before enrolling? Speak to the training team.

Enrol nowtraining@rounduptech.com